Skip to content


S&P 500/Russell 2000 Spread

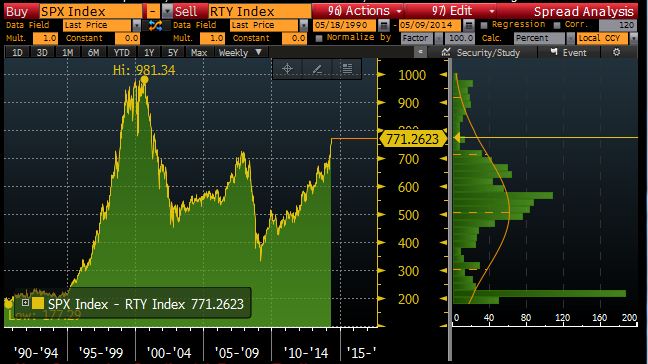
The spread between large cap and small cap stocks is a pretty simple metric, but it is hard to ignore historical correlation to corrections:

Russell SPX Spread

More interesting than the magnitude of the spread is that the Russell 2000 recently broke through its 200 day moving average while the S&P 500 was making new highs:

200 Day moving Average 2014

This same anomaly happened in July of 2007:

200 Day moving Average 2007

Draw your own conclusions.

Posted in Markets, Technical Analysis.

Tagged with , , .


Copyright © 2009-2013 SurlyTrader DISCLAIMER The commentary on this blog is not meant to be taken as an investment advice. The author is not a registered investment adviser. There is no substitute for your own due diligence. Please be aware that investing is inherently a risky business and if you chose to follow any of the advice on this site, then you are accepting the risks associated with that investment. The Author may have also taken positions in the stocks or investments that are being discussed and the author may change his position at any time without warning.

Yellow Pages for USA and Canada SurlyTrader - Blogged

ypblogs.com