Let us first describe the action that has taken place over the last few trading days. The 16% drawdown that occurred last summer because of the Greek and Eurozone crisis took a bit over 2 months, even with the May 5th flash crash. The current drawdown of over 18% has taken only 13 trading days, and much of that drop happened in just a few days:
My general feeling is that this move is nothing like the correction that happened in the summer of 2010, it feels a lot more like the dry up in liquidity that happened after Lehman Brothers imploded. What really stands out, aside from the quick drop in the S&P 500, is the precipitous drop in US interest rates across the board. The current 10 year rate of 2.29% represents nearly zero future growth OR a significant flight to perceived quality regardless of what S&P says:
My feeling is that the recent market moves have little to do with S&P ratings downgrade and much more to do with a flood of money out of Eurozone areas along with a significant level of fear regarding a double dip recession. My double dip recession fears are significantly smaller than most pundits out there. I do believe it is possible we are in a small recession or entering into a recession, but I do not believe that the magnitude of this drop could reach anywhere near 2008. I also believe that the US Federal Reserve is more than eager to do anything in their power to dampen the blow. Those actions are made significantly easier by a total lack of inflation, persistently slow recovery and large unemployed population.
The largest question to answer is how the Eurozone crisis gets resolved and what a significant default would mean to the European banking system and the global financial markets. My own feeling is that sovereign defaults are less of binary outcome than corporate defaults like AIG or Lehman Brothers. They do not happen overnight. After Lehman went under, the fear that drove the markets lower was that you could not lend your money to anyone because they will not pay you. What really drove the fear of contagion was the immediate lack of liquidity by corporations after there was any subtle hint of insolvency. Suddenly, people withdraw money from all banks and massive global companies cannot fund themselves in overnight markets (General Electric). The liquidity issue should not occur on the same scale with developed governments as it does with private corporations. The Eurozone can print Euro’s for Greece, or Greece can start printing Drachma’s again. In addition, global central banks are injecting massive amounts of liquidity via easy monetary policy as a response to the 2008 slowdown. The Fed is lending money to anyone who will ask, which should help stop the system from seizing up like it did in 2008.
As final comparisons, it is important to look at where we are. The global economy is not in a an overly exuberant “boom” cycle. Investors are still fearful and the global recovery has been slow. Corporations and investors have not been expanding at overly ambitious rates, so it is hard to see how the pullback could be nearly as strong. It is also important to look at what caused most of the pain – the housing market. Housing prices are already depressed and it is difficult to see another huge drop in prices unless we believe in a massively pessimistic outlook.
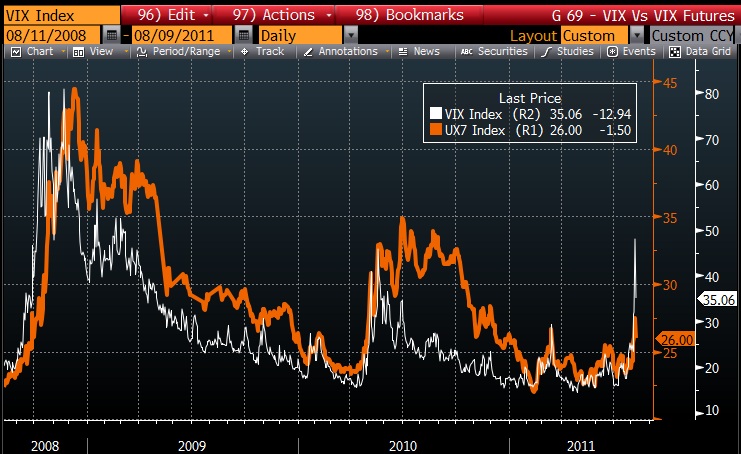
I could look for many data points to try to back up my own lack of immense fear such as corporate profits, earnings yield on the S&P 500, or the lean operations of S&P 500 companies. Instead, I wanted to point out an interesting market signal which is the difference between what the VIX and longer dated VIX futures. In 2008, the VIX spiked to about 80% and the 7th VIX futures contract spiked to about 45%. In 2010 the VIX spiked to about 45 and the 7th VIX futures contract spiked to about 35. In this latest drop, we saw the VIX spike to 48%, but we only saw the 7th contract spike to 27.5% which was only slightly higher than what it reached in March of this year:
This is not the perfect symbol, but I would say that it indicates the volatility markets are saying this is a short lived drop rather than a return to depression like economic and market conditions.


